
Creating infographics – The best tools
Natalie Ediger, June 17, 2020· Cleverclip

In our last blog post I was talking about the infographics being a powerful tool in content marketing. With the help of graphic elements and a creative design, an infographics communicates your message effectively, understandably and clearly to the target group and thus creates more brand awareness. Well, but how does that work in practice? You may have learned all the important elements, have a groundbreaking idea to captivate the viewer with magical storytelling in your infographic. And now you ask yourself how to create the infographics in the first place? Well hang on tight! In this article we’ll introduce some tools that make it easy to create stunning infographics.
Creating infographics with online tools
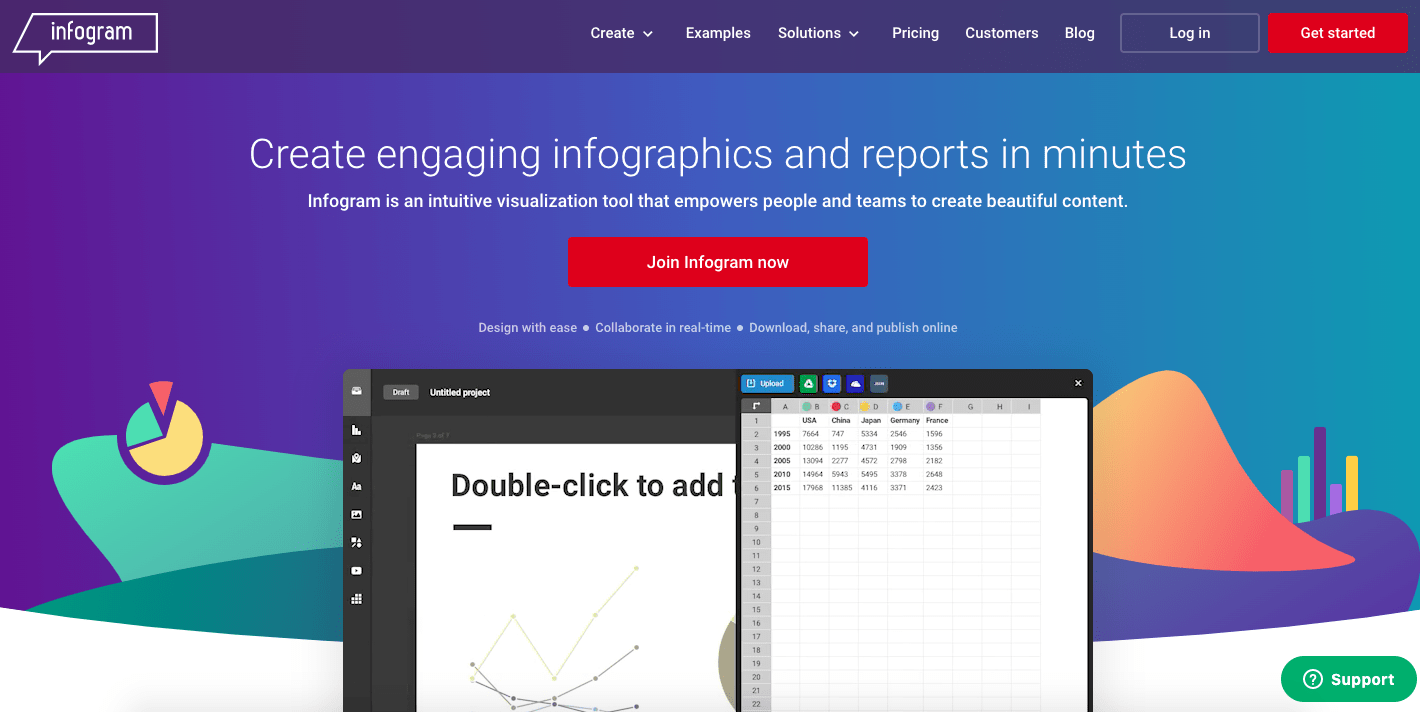
Infogram is a design tool that focuses primarily on the quick and easy creation of statistical infographics. Thanks to a large number of diagrams and graphics, complex data sets can be visualized in a clear and concise way. Additional tools such as data and engagement analysis and link tracking are also being offered. When it comes to creative design, however, you are a little limited in the templates, especially in the free version. But as a number lover you will find everything you need to bring your facts and statistics to life.
Price: Free version as well as various price packages starting at $18
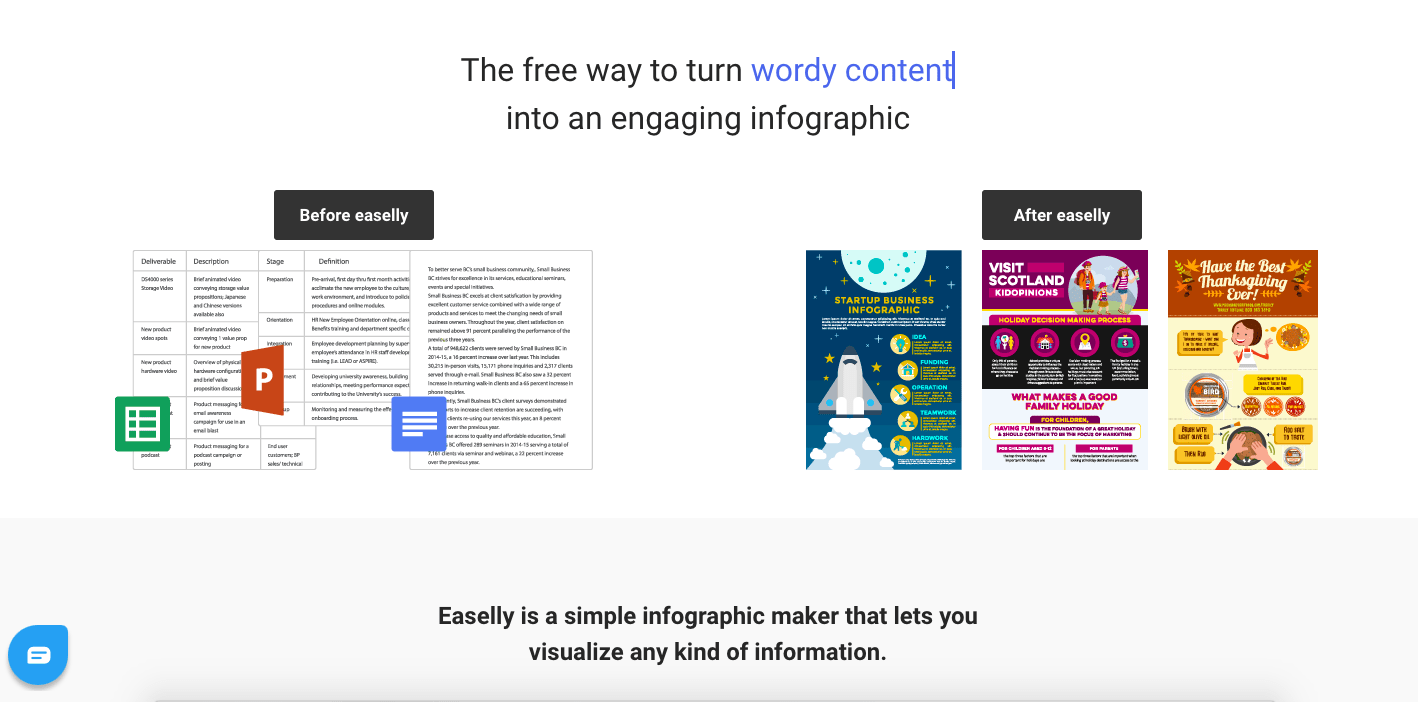
As the name suggests, the creation of infographics on Easel.ly is quite “easy”. Just choose a template from any category and customize it to your needs.
Especially the premium version offers many features and a large database of ready-made templates, graphics, fonts, diagrams etc. The only downer: It is not possible to import external tables, so all data must be entered manually.
Price: free version and various “Pro Accounts” starting at $4
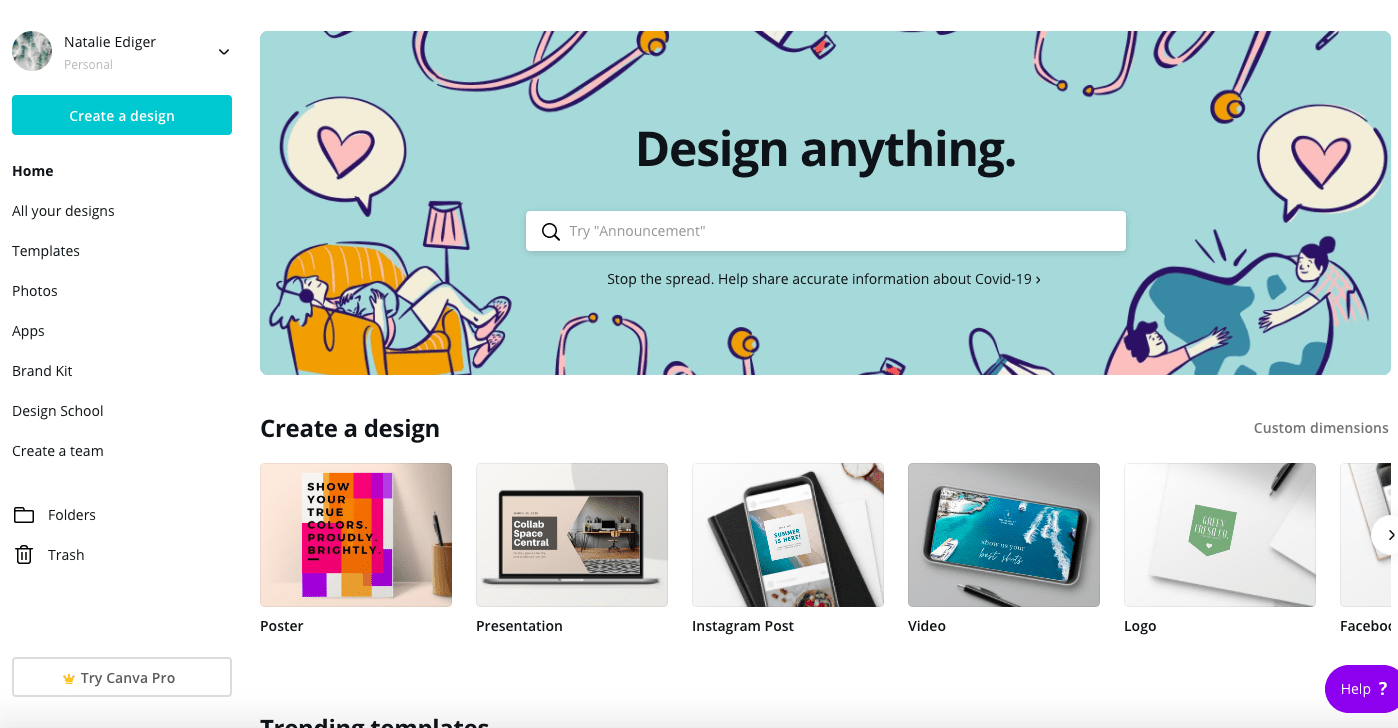
Canva
With Canva you can create all kinds of projects, from social media banners, poster ads, business cards, presentations to infographics. It is characterized by its high usability, but still offers a large database of templates, graphics, fonts, icons, etc. Thus a perfect graphic design tool for beginners as well as professionals.
Price: Free version with occasional paid elements (e.g. images) from $1. A premium version is also available from $12.95.
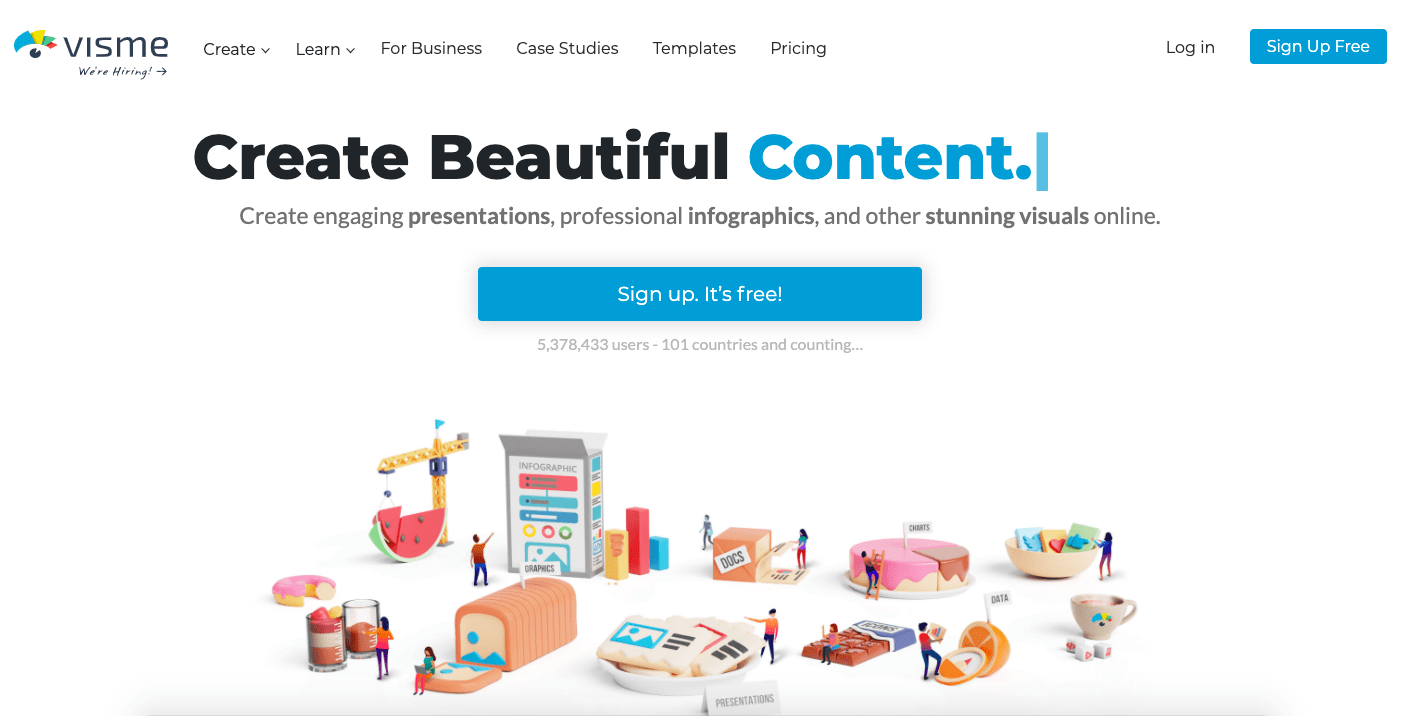
Visme is a versatile design tool that is primarily aimed at marketing people. Its strength definitely lies in meaningful infographics: With over 100 free fonts, millions of images, icons and endless design elements, including video, audio and voiceover options, you can prove your creative vein. Despite the numerous functions, it’s still user friendly thanks to drag and drop functions. Besides infographics, it also allows you to create presentations, animations, layouts, banners.
Price: Both a free version and different price packages
Here you can also create infographics using templates based on different categories, including statistics, processes, maps, timelines, etc.
Venngage also offers a Social Analytic Tool: You can connect the platform with Facebook, Twitter, Google Analytics, Adwords or Pinterest and measure the success of your campaigns with tracking codes.
Price: Both free and various premium versions starting at $19/month.
If you have never created an infographic before, pictochart might be a good start. It is an easy to use tool with drag and drop functions, but still offers a large database of visual elements and templates. If you still find it hard to get started, don’t worry! Piktochart also offers good step by step tutorials.
In general it is recommended to work with the premium version, as the free version allows only 5 images with a Pictogram branding.
Price: free version and various price packages starting at $12.50 /month.
Snappa is a good tool if you want to create an infographic as quickly as possible. The good thing about it is, that even with the free version, you can use almost all features. In addition to infographics, you can also create various social media posts and many other designs. It offers a good selection of templates, although they can’t be customized like in most of the previously discussed tools. But if you are looking for a quick and easy infographics tool, stop looking further.
Price: Free and starting at $15 per user per month.
A widely used tool, which is primarily known for image editing, but also allows the creation of infographics. A large database of templates, icons, images and fonts is at your disposal. You can use the Picmonkey’s library, but you can also upload your own pictures.
Price: Free trial version, otherwise from $12.99/month
Adioma allows you to easily transform your text data into an appealing infographic. It also offers a large database of templates and icons. You simply choose a suitable template, upload your text and Adioma will automatically create an infographic for you. An upgrade to the paid version offers you a number of additional features, including better download options and the option to integrate your own content.
Price: free version and various price packages starting at $39 per month.
A tool mainly for editing and creating professional photos, but also with an extensive infographics tool. You should definitely switch to the premium version, as the free version offers one template only. BeFunky enables a connection with Unsplash and Pixabay, two very popular databases for stock images. Furthermore it has some high quality image editing options that are much more extensive than in other tools. The step by step tutorial is also very useful.
Price: Free basic version and from $4.99/ month for the premium version
A very promising tool for high-class HD videos and animated video infographics. It offers a large database of infographics video templates, that can be spiced up with different images, icons, fonts and other elements according to your individual needs. The free version allows you to create 10 projects, which can be shared on Facebook or Youtube later. If you want to save the file or share it on other social networks and get rid of the watermark, you have to go for the upgrade.
Price: Free and Premium version starting at $19/month.
If you are looking for a tool that allows you to create infographics quickly and easily, especially for social networks such as Instagram, Facebook and Pinterest, Adobe Spark is the right choice! It offers over 10,000 templates, thousands of license-free elements and easy handling thanks to drag & drop functions. You can also import your own pictures and graphics and add a logo. Each design can be easily changed after completion to optimize it for a different social platform.
Price: Free basic version and from $9.99/ month for the premium version.
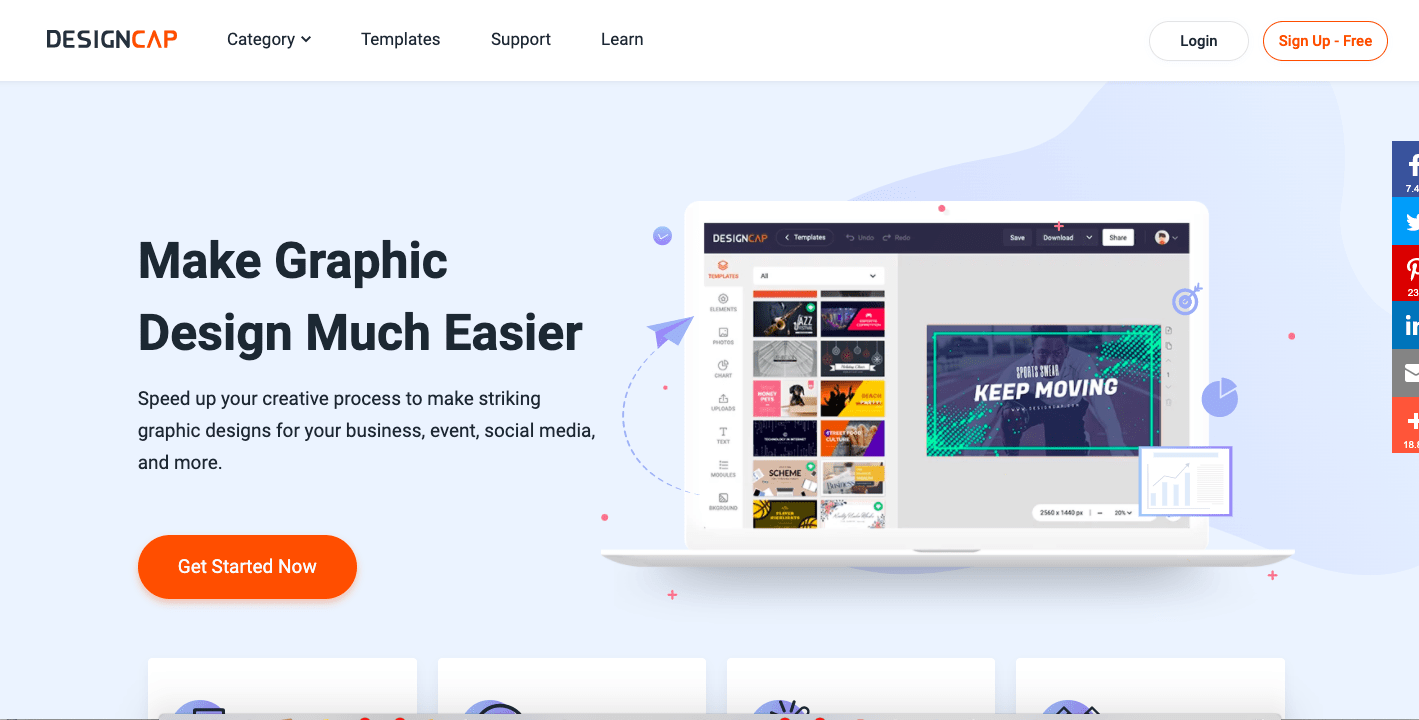
DesignCap is an easy-to-use tool with a variety of templates, icons, illustrations and stock images. The free version allows a maximum of 5 exports and limited template usage. It is therefore definitely recommended to switch to the upgrade. The basic version is also available from $4.99 with unlimited templates and png and pdf exports in high resolution.
Price: Free version and various prize packages starting at $4.99
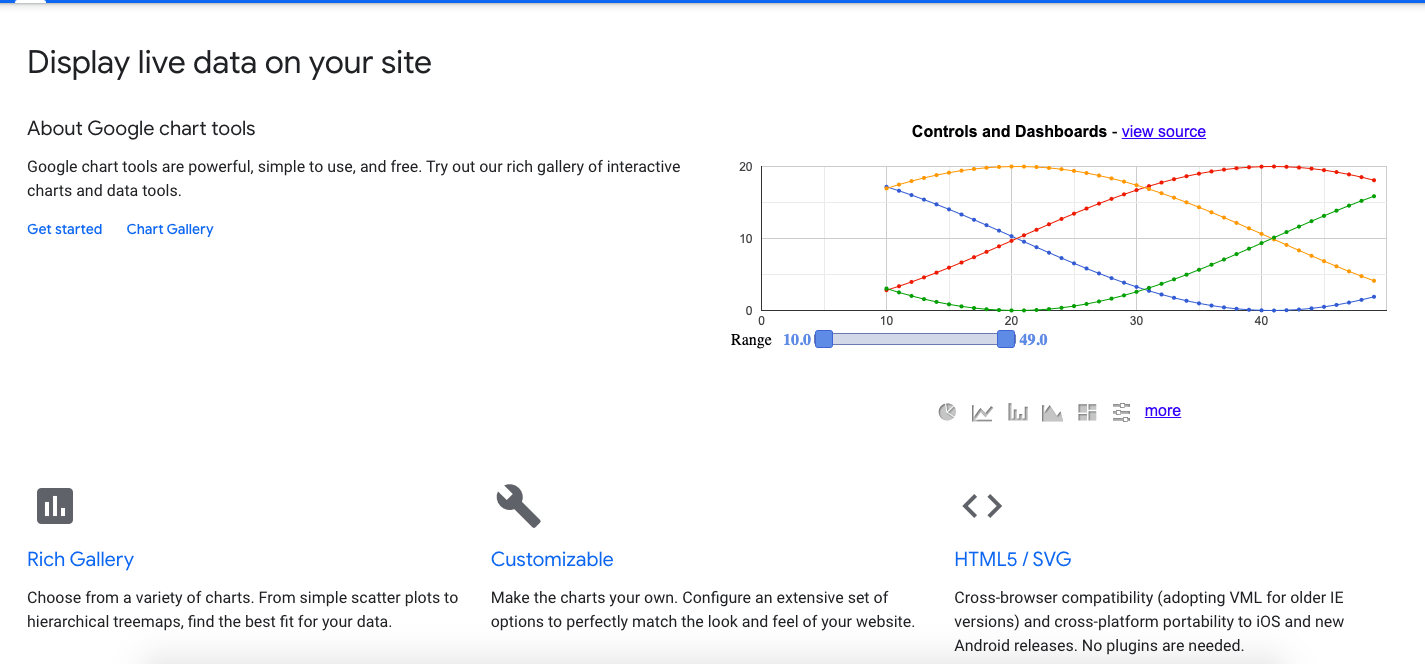
A Javascript based charting tool that is easy to use, yet powerful and versatile. You can choose from a range of diagrams and optimize them according to your preferences with different elements in real time.
Price: Free
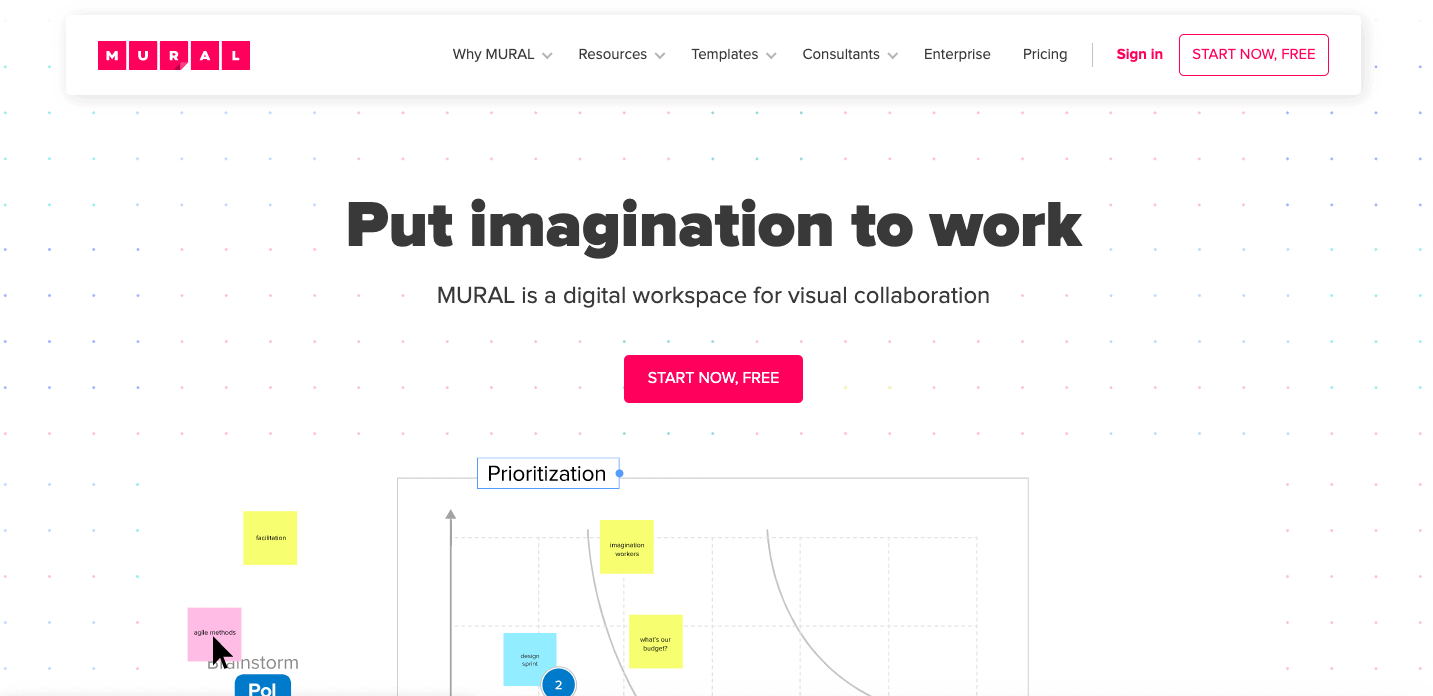
Mural is an infographics tool that allows collaboration with other team members in real time. Users can draw on a whiteboard and share feedback on notes with team members. So if you work with remote teams and want to share data visually, Mural is a great infographic tool for you.
Price: free version and various price packages starting at $12/month.
Of course, you can also create infographics using PowerPoint. Depending on the distribution channel, you can simply change the format of the slide to an individual size.
With this canvas you can work as usual, add colours, fonts and shapes and thus create a very individual infographic. However, especially in the beginning it can be difficult to work completely without a template to create an effective and well structured infographic.
Meanwhile there are many providers that offer free PowerPoint templates. Hubspot provides for example 10 templates and explains in a blogpost how to create different infographics using them.
Now which tool is the right one?
Of course it depends on your needs and the purpose of the infographics. Should it be an interactive infographic? A statistical? Or map-based? If you define some criteria at the beginning and know your target group, you can narrow down the choice a little bit.
In addition, the right software always depends on your own preferences. When it comes to layout and handling, we all have different preferences. I think it makes sense to take some time at the beginning and test which tool you like the most.
Option 2: Working with an agency
Despite the variety of options that are now available online, creating an infographic can be a challenge. An infographic is only effective if it presents relevant information in a clear and appealing way and provides the audience with a decisive added value. Depending on your goal, target group, topic and personal preferences, it can therefore make sense to work with a professional agency.
The investment may be higher than for self-created infographics, but a professional agency also knows exactly how your message can be conveyed in the best possible and most creative way into a vivid graphic. By the way, a good agency will also always try to find a good solution for different budgets.
At Cleverclip, for example, we work together with the customer to find the best possible approach for the project implementation. Our projects usually start with a creative workshop where we gather all the necessary information regarding the topic, the target group and answer any arising questions . According to the customer feedback, we develop a suitable style that perfectly conveys the information adapted to the target group. You can read more about our production process here.
So what, have you already made infographics part of your content strategy? If not, then it’s about time! As you can see, there are really a lot of options to create the infographics quickly by yourself or even have them created for you. You are now spoilt for choice! Are you using a tool that is not in this list, but definitely deserves a place of honor? Then let us know, we are looking forward to your feedback!